Plot lines in python
# importing package
import matplotlib.pyplot as plt
import numpy as np
# create data
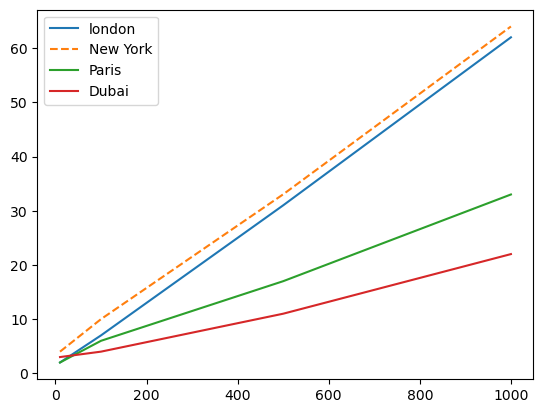
x = [10, 100, 500, 1000]
y = [2, 7, 31 , 62]
x1 = [10, 100,500, 1000]
y1 = [4, 10, 33.0294988155365, 64 ]
x2 = [10, 100,500, 1000]
y2 = [2, 6, 17, 33]
x3 = [10, 100,500, 1000]
y3 = [3, 4, 11, 22 ]
# plot lines
plt.plot(x, y, label = "london", linestyle="-")
plt.plot(x1, y1, label = "New York", linestyle="--")
plt.plot(x2, y2, label = "Paris", linestyle="-")
plt.plot(x3, y3, label = "Dubai", linestyle="-")
plt.legend()
plt.show()