using numpy and matplotlib, taxi and passengers example – python to plot two lines
import matplotlib.pyplot as plt
import numpy as np
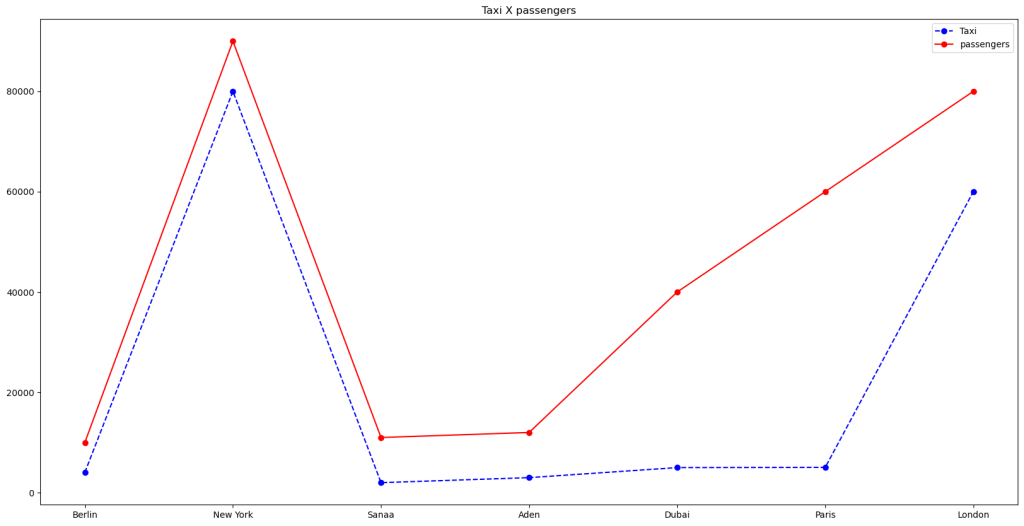
names = ['Berlin' , 'New York', 'Sanaa', 'Aden', 'Dubai', 'Paris', 'London' ]
taxi = np.array([ 4030 ,80000 , 2000, 3000, 5000, 5040, 60000 ])
ppl = np.array([ 10000 ,90000 , 11000, 12000, 40000, 60000, 80000 ])
y2 = np.array(taxi)
y3 = np.array(ppl)
plt.figure(figsize=(20, 10))
plt.plot(names, y2, marker='o', linestyle='--', color='b', label='Taxi')
plt.plot(names, y3, marker='o', linestyle='-', color='r', label='passengers')
plt.title("Taxi X passengers")
plt.legend()
plt.show()