The two most commonly used statistical tests for establishing relationship between variables are correlation and p-value. Correlation is a way to test if two variables have any kind of relationship, whereas p-value tells us if the result of an experiment is statistically significant.
#load data frame from the csv file
import pandas as pd
df = pd.read_csv("nba.csv")
import pandas as pd
import numpy as np
import seaborn as sns
import matplotlib.pyplot as plt
from scipy import stats
def plot_cor_matrix(corr, mask=None):
f, ax = plt.subplots(figsize=(11, 9))
sns.heatmap(corr, ax=ax,
mask=mask,
# cosmetics
annot=True, vmin=-1, vmax=1, center=0,
cmap='coolwarm', linewidths=2, linecolor='black', cbar_kws={'orientation': 'horizontal'})
def corr_sig(df=None):
p_matrix = np.zeros(shape=(df.shape[1],df.shape[1]))
for col in df.columns:
for col2 in df.drop(col,axis=1).columns:
_ , p = stats.pearsonr(df[col],df[col2])
p_matrix[df.columns.to_list().index(col),df.columns.to_list().index(col2)] = p
return p_matrix
res_age = []
res_Weight = []
for i, c in zip(df['Age'], df['Weight']):
res_age.append(i)
res_Weight.append(c)
df_new = pd.DataFrame(res_age, columns=['Age'])
df_new['Weight'] = res_Weight
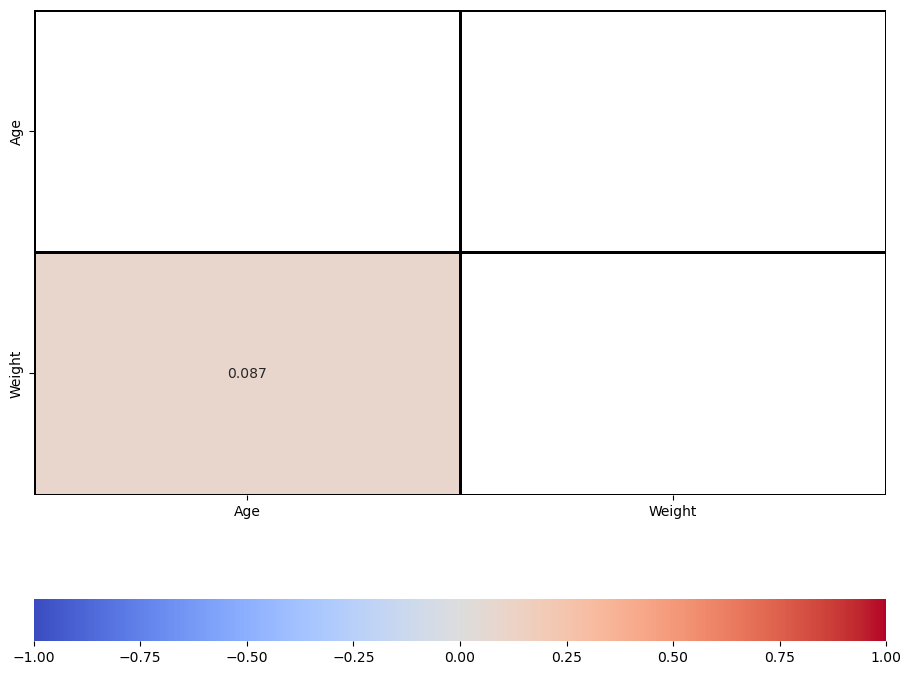
corr = df_new.corr()
mask = np.triu(corr)
plot_cor_matrix(corr,mask)
plt.show()
corr = df_new.corr() # get correlation
p_values = corr_sig(df_new) # get p-Value
mask = np.invert(np.tril(p_values<0.05)) # mask - only get significant corr
plot_cor_matrix(corr,mask)